Got a second hand Sky-Trac treadmill. A NZ only brand imported a few years ago. Importer moved onto other things so no support but you don’t need much for a treadmill. No idea what other names these go by.
The instruction manual had a list of the in-built programs (56) typed into the manual. Needless to say not very useful as text.
So I decided to get Inkscape and some csv working together and write a litttle program to extract and graph the data in a useful way. Then print it out as a sheet to be hung on the treadmill for daily use. Maybe…
Regrettably it looks like I’ve lost the code 🙁 but here’s what I did. On page 11 of the manual is the program list. It has 56 programs. Each program has 10 steps. Each step has a speed and an incline setting.
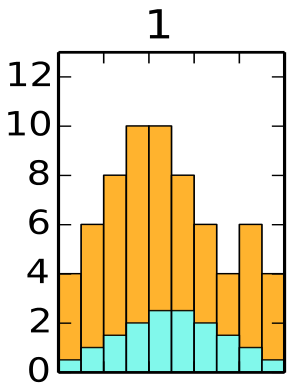
E.g. for Program 1
P01 – 4/1, 6/2, 8/3, 10/4, 10/5, 8/5, 6/4, 4/3, 6/2, 4/1
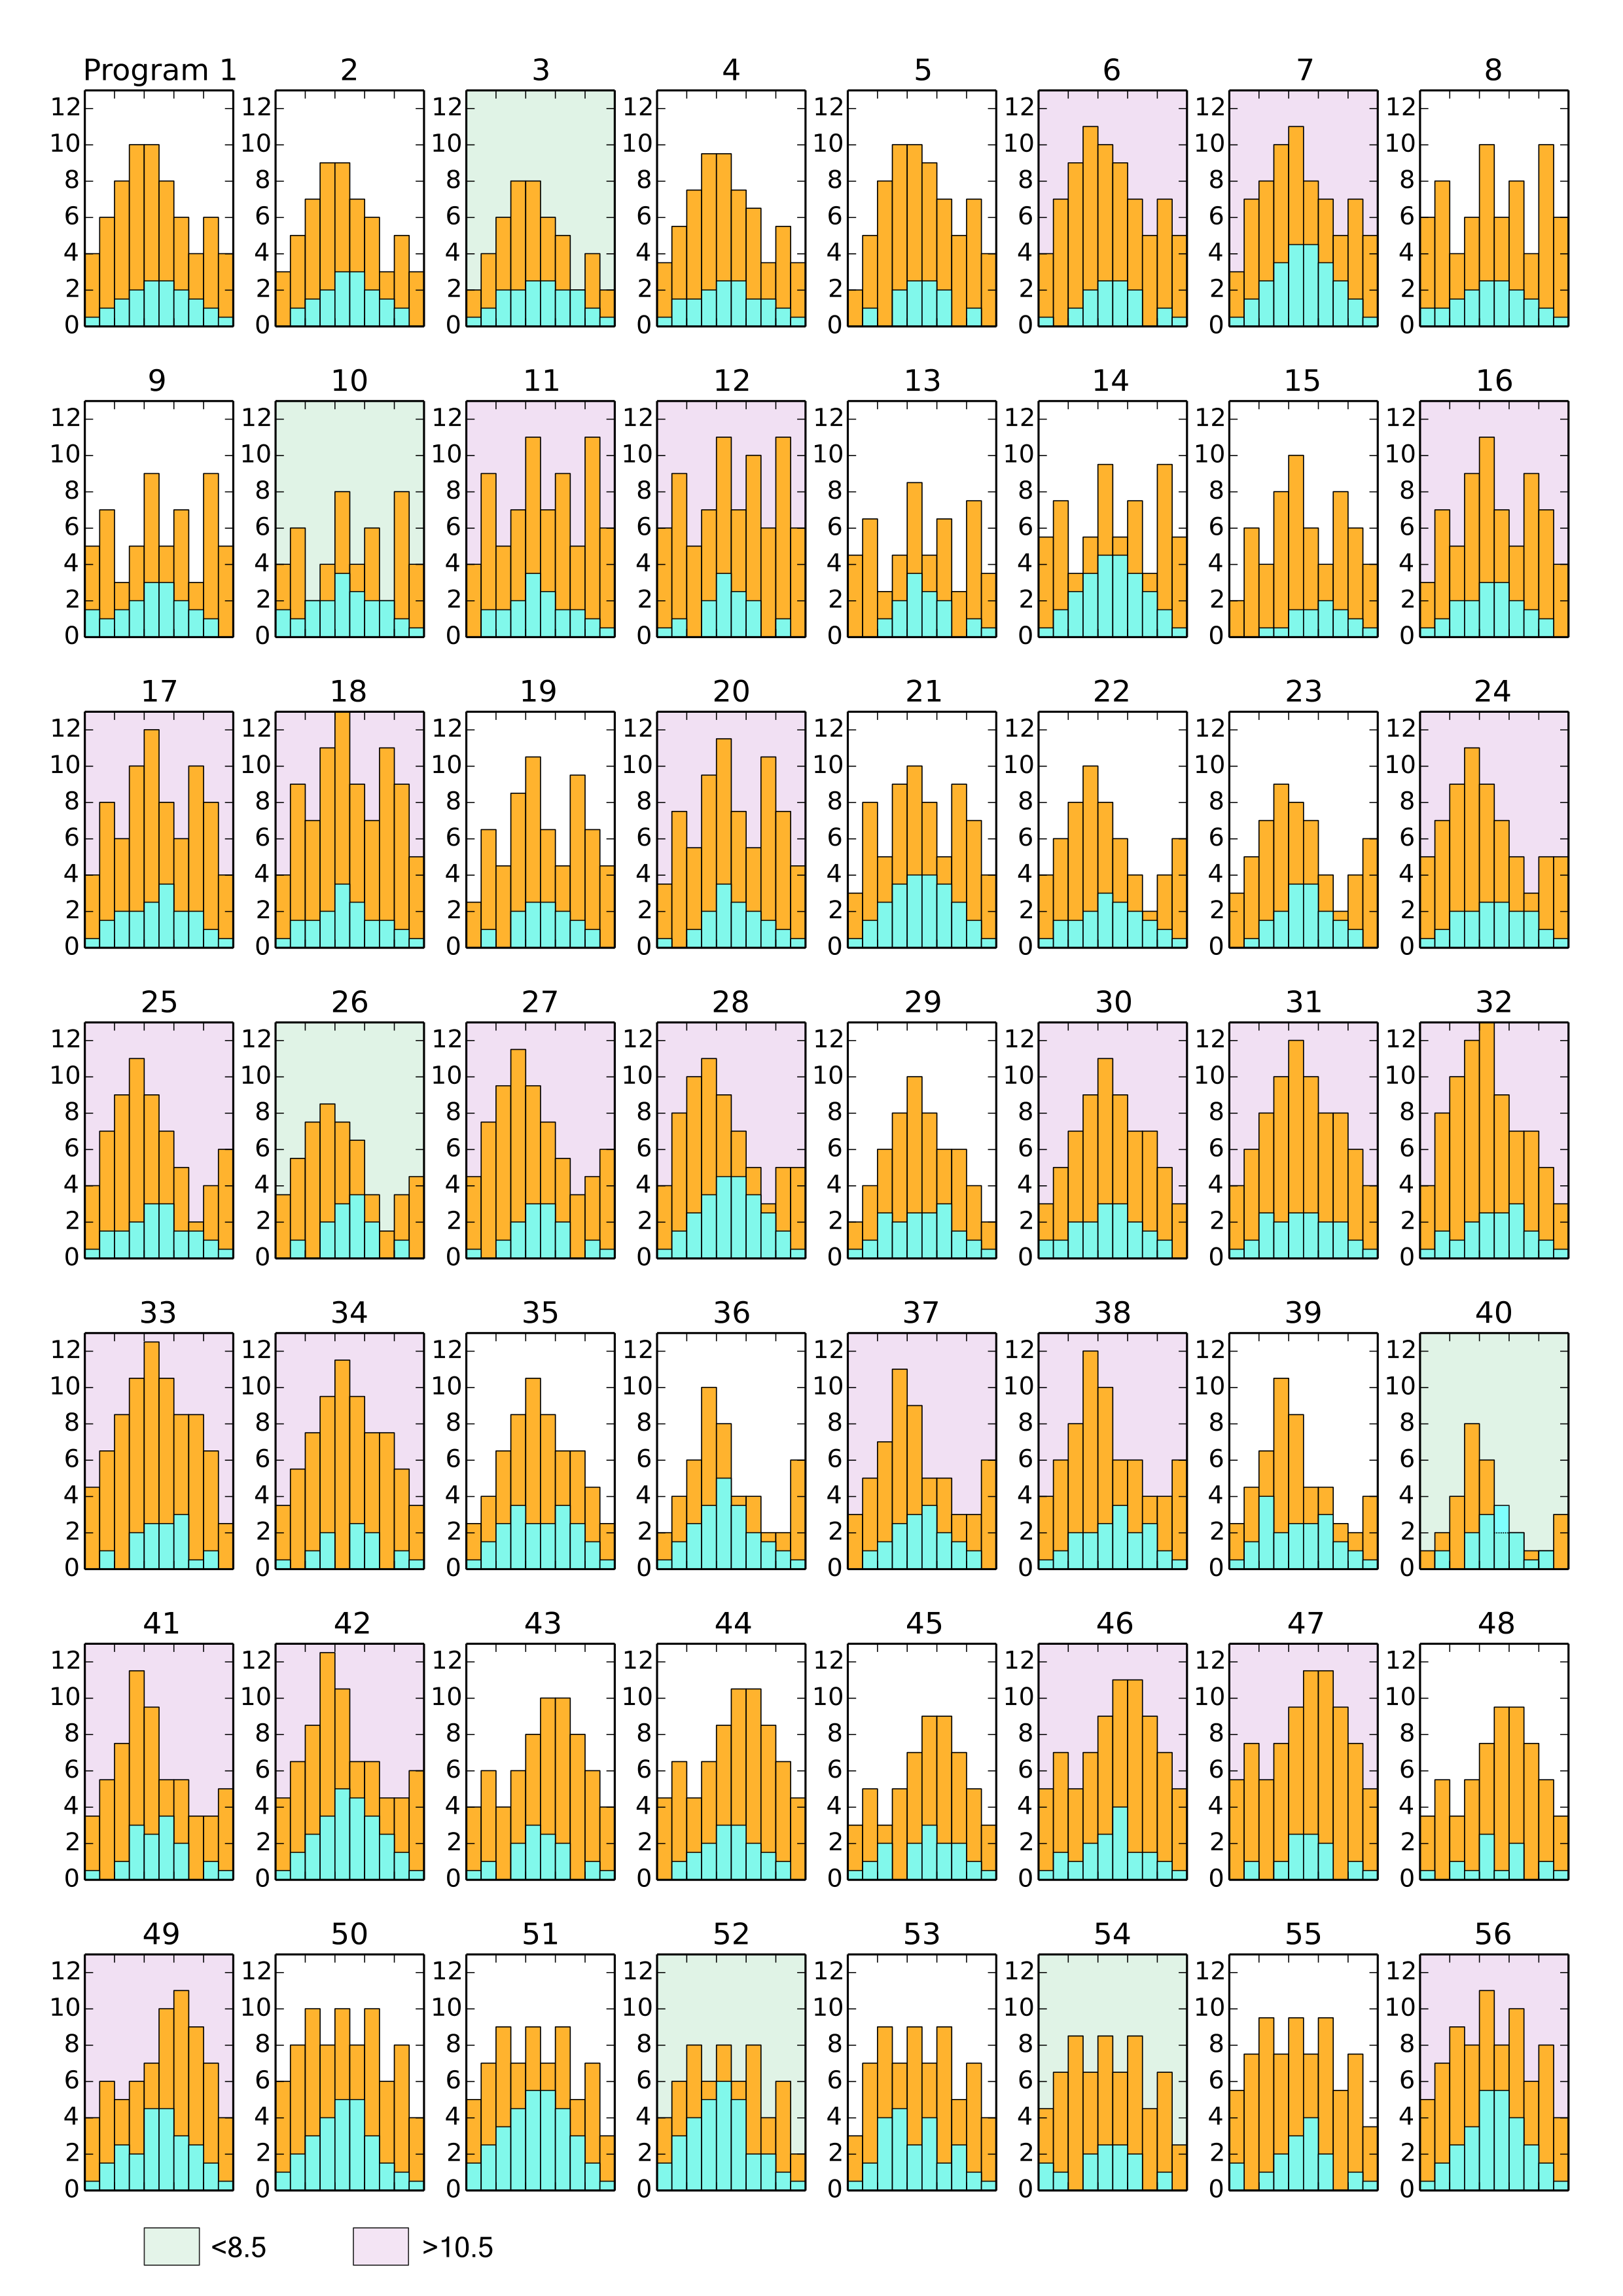
I found the min max of everything and ended up with a display like this. Which looks quite good to me and prints well with useful contrast and colour. The speed is in Orange. The incline is in Blue/Green.
 Further to this I noted that there were several styles of pattern and also some programs were clearly harder than others.
So I grouped them into three styles of difficluty. Easy was green, white was average, and purple was difficult.
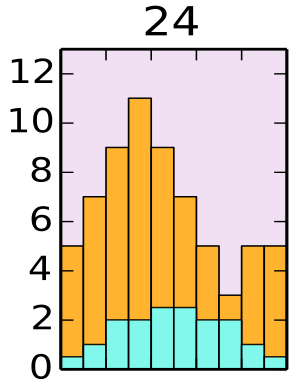 Pattern 24 was more difficult with higher intensities.
Pattern 10 was easier but also had several intervals.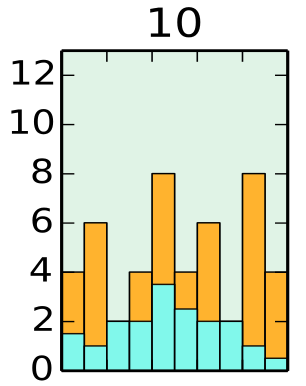
So I grouped them by style, with somewhat aritbrary labels, andthe three difficulty levels.
The final result was printed as two sheets. All the programs are on each sheet but organised in numerically increasing order (you have to select a program by incrementing or decrementing the index) and by style.
Here are ethe two sheets. If you have a SkyTrac treadmill and these programs are the same on your version, then please feel free to laminate this up and attach it to your treadmill. (Designed for A4 paper of course).